How these markets are different from the rest, and how to maximize your potential in each
One of the many themes in the Clicks to Bricks Playbook is the consistency of patterns in DTC brands’ data
Ironically, one of the many consistencies across brands is the inconsistency of consumer behavior in a few key MSAs:
- New York-Newark-Jersey City NY-NJ-PA
- Los Angeles-Long Beach-Anaheim CA
- Miami-Fort Lauderdale-Pompano Beach FL
These are some of the largest MSAs for DTC brands — usually making up 20% or more of their business in total — so it’s important to understand their nuances as you evaluate those geographies’ sales performance, and especially when you start thinking about building a retail footprint.
In many past newsletters I’ve mentioned how I think MSAs are great proxies for many brands’ store trade areas. And technically they are, but there are some market features unique to each of these markets that drive some nuances that may not be so obvious. These markets are each unique for one more of the below reasons, depending on the market:
- Competitive landscape
- Geographic characteristics
- Public transportation availability and usage
- Demographic makeup
Let’s dig in…
New York-Newark-Jersey City NY-NJ-PA

As a reminder, MSAs are agnostic to city and state boundaries. Despite that, this MSA is typically referred to as the “NYC MSA,” which can be a little misleading given it captures parts of the entire tri-state area (NY+NJ+CT).
What makes MSAs so valuable is that they take into consideration the typical commuting paths that center around a single nucleus: in this case, Manhattan. But this is also a downside to a market as unique as this one, since it makes repeatable analysis difficult.
To anyone that lives in the tri-state area, it’s obvious that (1) there is a large commuter and reverse commuter population, and (2) the subway is the most common form of transportation across nearly all demographics. Whether you’re making 5, 6, or even 7+ figures income, chances are you still take the train to and from work. The city is also one of the easiest to navigate:
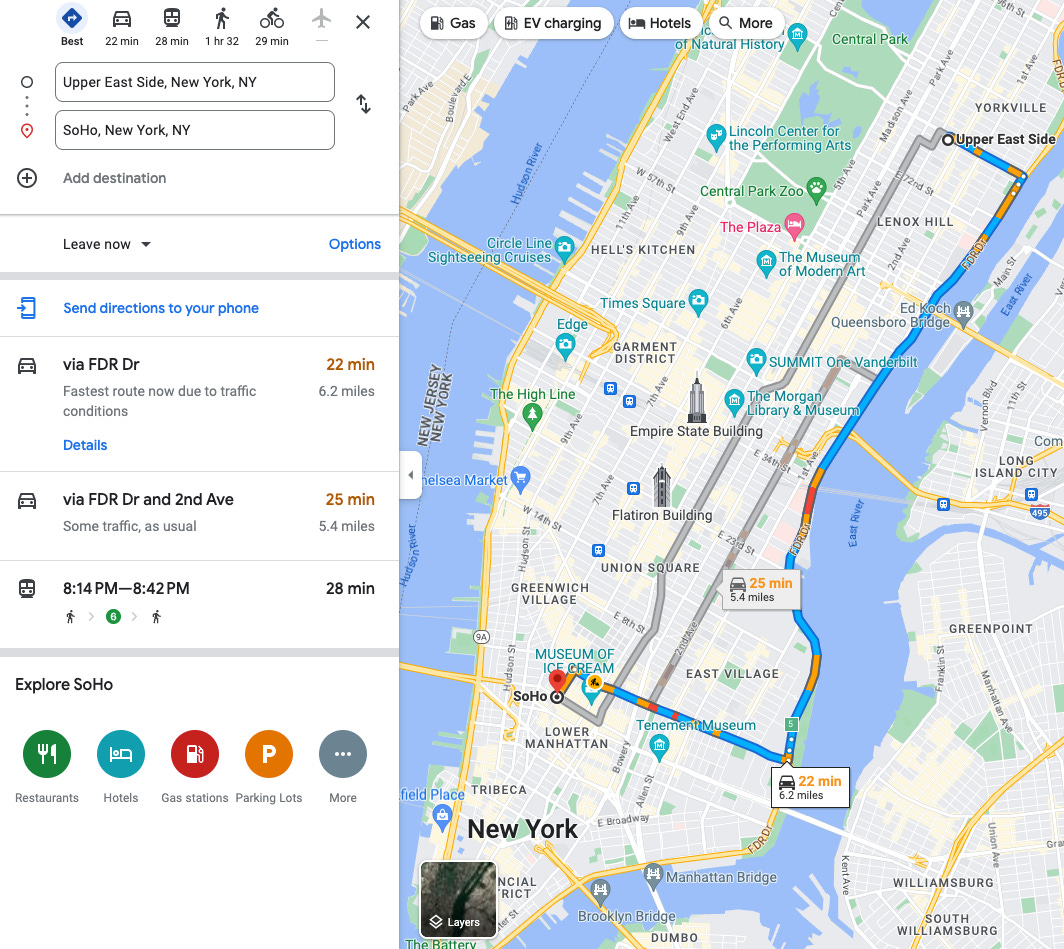
You can get to most places within 30 minutes, and certainly within an hour — which makes trade areas a lot tougher to map and understand using drive times. Stores in SoHo still serve customers as far away as the Upper East Side because of how transient the city is. Unfortunately, that also means the traditional drive time trade area isn’t really a great fit:
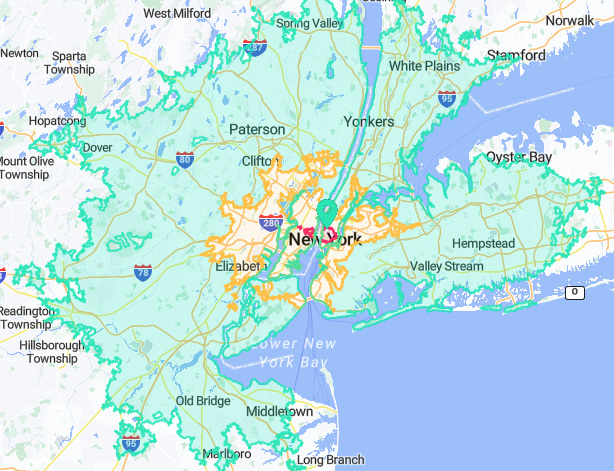
For anyone who lives in the area, it’s pretty obvious that this isn’t an accurate portrayal of a SoHo store’s pull. However, when we shift to trade areas as defined by public transportation, it seems far more representative of reality:
Clicks to Bricks: The Playbook is a reader-supported publication. To receive new posts and support my work, consider becoming a free or paid subscriber, or visit 1rec.co to read how we unlock DTC brands’ growth with geospatial analytics.
Subscribed
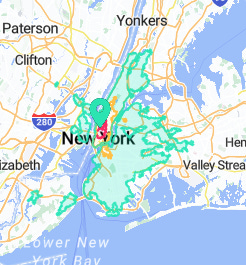
And now zoomed in…
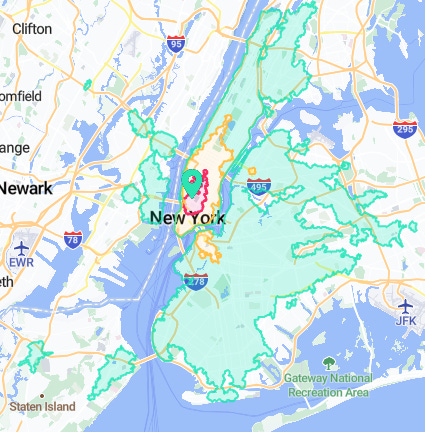
Applying a typical drive time would likely lead you to believe that a potential store’s trade area opportunity is much bigger than it really is.
Another unique aspect about this MSA is its fierce, global competition — and as a result, its lack of customers’ brand loyalty.
I’ve described this before, but there was a time when I was helping a brand dig into its company-wide underperformance for a certain week, and no team could answer why the business didn’t grow vs last year: all marketing channels were down, all sales channels were down, and all product categories were down — it appeared to be systemic.
Until we looked at the geographic breakdown:
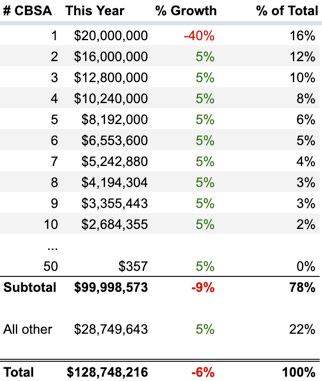
What I didn’t specify previously was that this was the New York-Newark-Jersey City NY-NJ-PA MSA. At a minimum, we could conclude that we were losing the customer in this MSA. While we couldn’t prove it, our suspicion was that (1) new competitors were entering the market (based on competitor store openings and anecdotes), (2) customers in NYC have access to virtually every brand at their fingertips, and (3) switching costs are not only low, but negative (due to many brands offering huge new customer discounts.) Put another way, to compete in this MSA you need to offer something above and beyond what you might do in another market — or someone else will. The NYC customer is tough to retain and usually has incredibly high expectations (and therefore higher CACs) as a result.
This MSA has so many other nuances, but we’re going to move onto the next:
Los Angeles-Long Beach-Anaheim CA
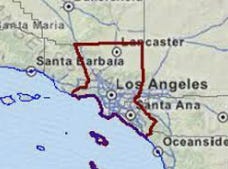
Los Angeles is huge. And that’s without accounting for the rest of the area in the broader MSA. In fact, it’s the largest MSA by square miles (according to Google Bard):

For reference, the broader MSA encompasses the below, ranging from north of Glendale all the way down south toward Mission Viejo:
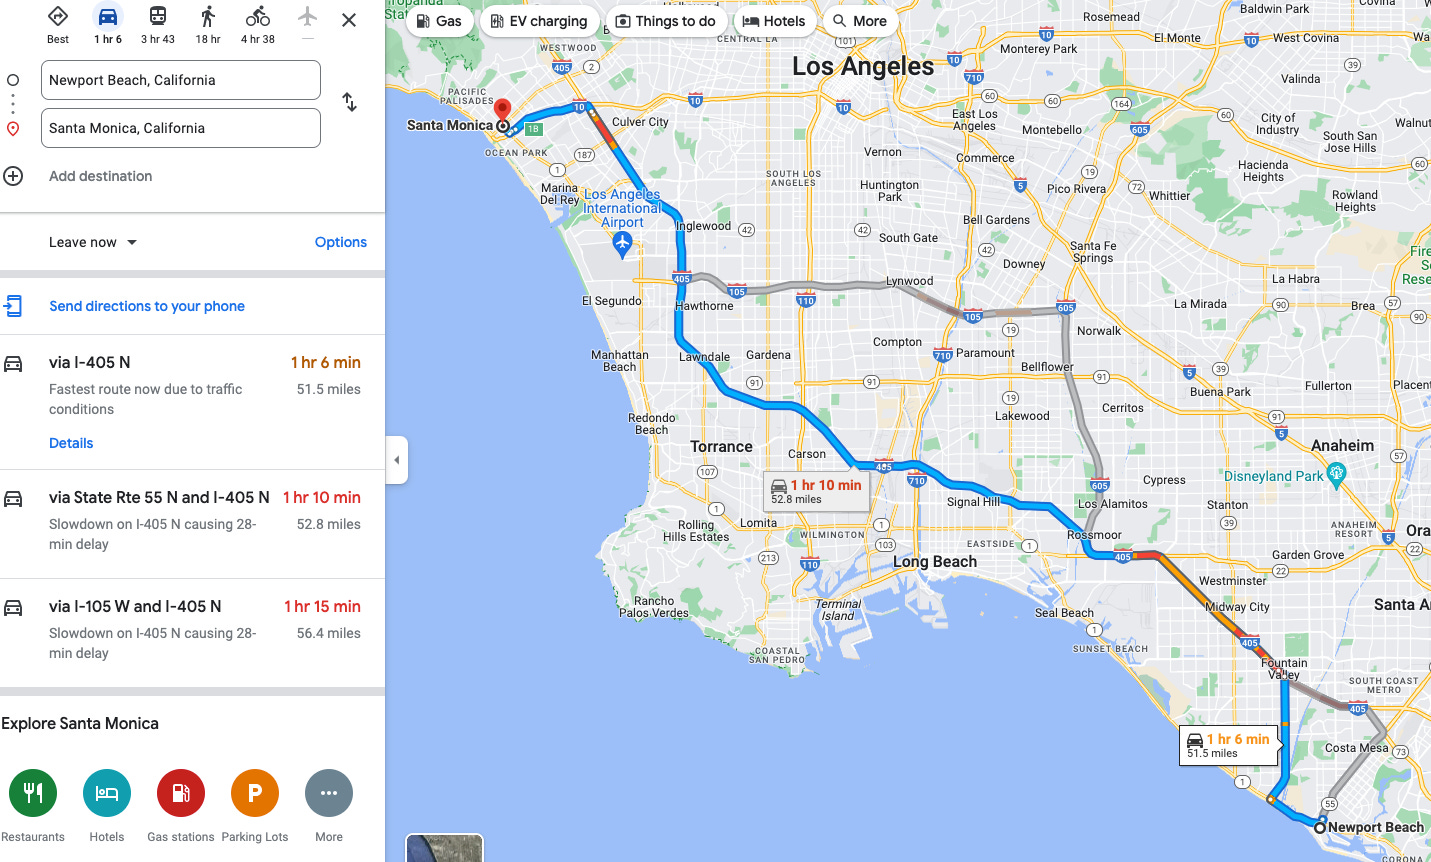
Unlike the New York-Newark-Jersey City NY-NJ-PA MSA, this MSA’s population does NOT commute quite as much or in the same way. Most residents drive vs take public transportation. While that alone is not unique to this MSA, what IS unique is the pure size of the MSA and the resulting unwillingness of residents to drive from one side to the other:
Because of its pure size, the Los Angeles-Long Beach-Anaheim CA MSA can generally support quite a few stores. Nike, for example, has 14 stores between its full price and factory locations — which ranks this MSA as #2 behind only NYC (19 stores; but only 8 full price vs LA’s 7). Bonobos, which is much earlier on in its store expansion journey, is a good illustration of where a brand of its size and age has planted its flags:
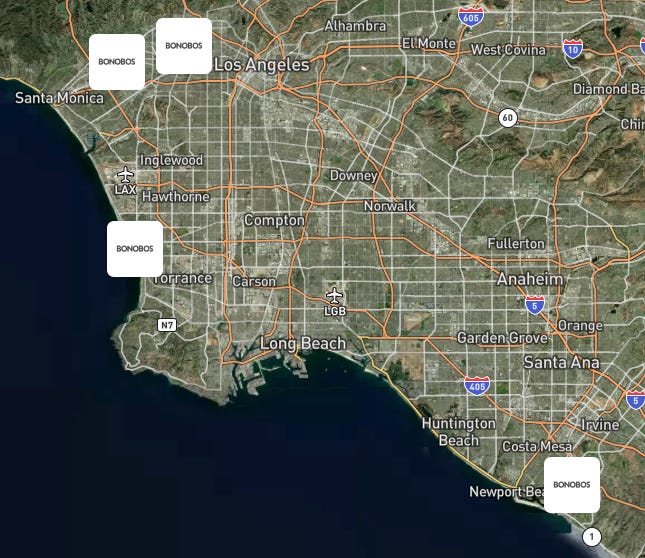
And now with drive times overlaid:
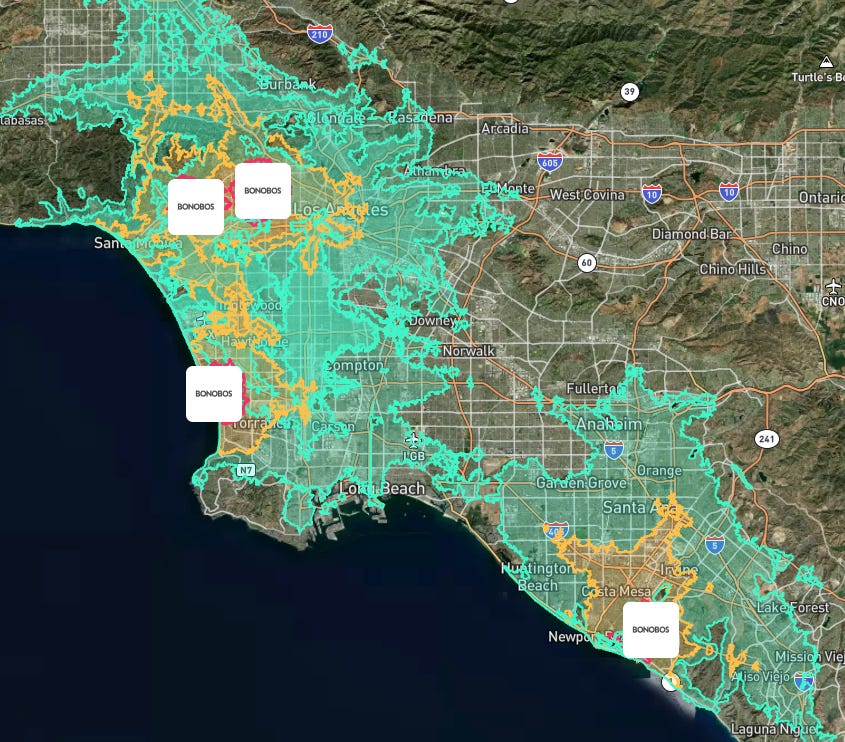
As the map reveals, the location in the bottom right (Fashion Island Mall in Newport Beach) only barely touches the outer edge of the El Segundo location’s trade area.
Combine this geographic enormity with the notoriously terrible traffic, and you’ve got an MSA that should be examined as a unique collection of strong submarkets.
Miami-Fort Lauderdale-Pompano Beach FL
The Miami MSA is notoriously hard to crack for many brands — even more difficult if you’re leveraging a showroom model, which was (and still is) an incredibly popular store format for DTC brands.
This is because Miami is one of the most touristed cities in the country:
- Florida tourists account for almost half of all overseas visitors to the U.S.
- With 2,759,000 visitors, the Magic City is not only the most popular destination in Florida but also the most visited city in the nation
- Tourism bounced back strongly following the Covid-19 pandemic with an 88.7% increase in visitor numbers in 2021
- Miami tourists also accounted for 30% of all overseas visitors to the U.S.
Tourism can be great for your brand if you let customers walk out with their purchases, but if you’re doing a showroom model (ie no inventory; as many DTC brands are), then (1) you need to be able to ship to South America and Canada (the most common origin countries of Miami tourists), and (2) the customer must be so in love with your product that they’re willing to transact with that wait time and international shipping price in mind.
Much like the Los Angeles-Long Beach-Anaheim CA MSA, this one also has a unique geographic landscape with limited public transportation and a series of coastal submarkets:
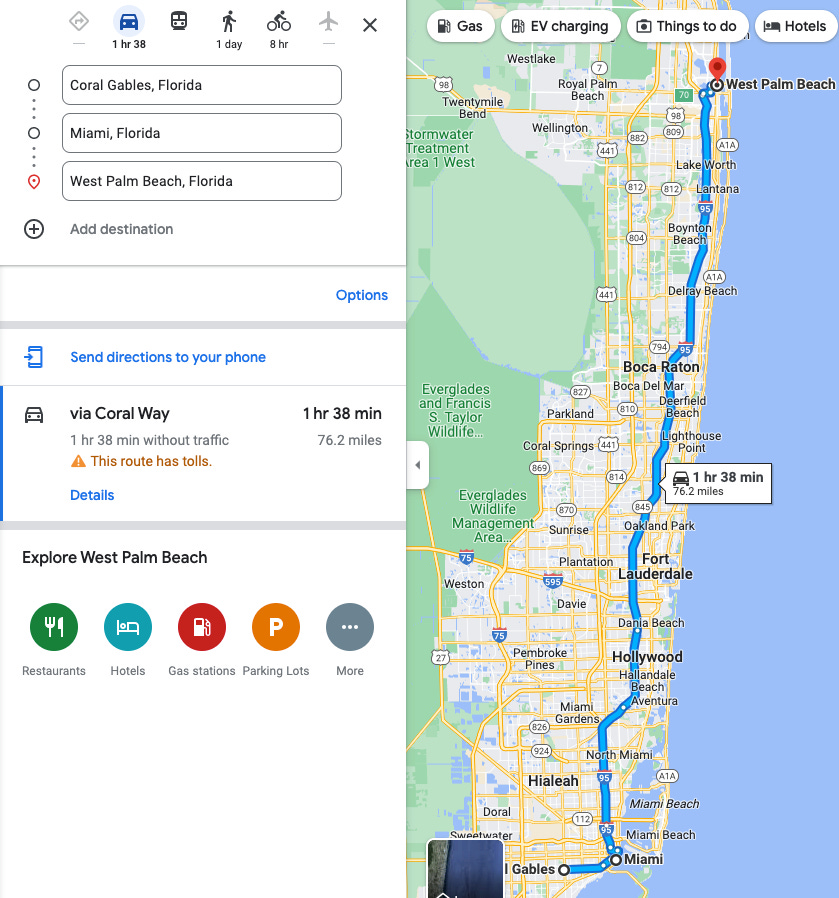
While the Miami MSA ranges from Coral Gables all the way up to West Palm Beach, it tends to be very much a “long tail” distribution: geographically it’s really large, but each individual submarket is not large enough to support standalone stores within the MSA for many smaller brands. Much of this is due to the seasonality of the market (snowbirds flock here), but this can also be offset by beefing up your NYC presence: most domestic tourists in Miami are coming from NYC.
So even though the MSA is large, it’s spread across such a wide area that it can be difficult to expand retail aggressively in this market unless you can unlock the tourist population and really squeeze a lot out of the snowbirds during their limited stays.
While most markets tend to have similar behavioral traits, these three in particular tend to create outliers in the data.
Author: 1rec_admin
1REC Founder


