There’s a book called “Prisoners of Geography” by Tim Marshall that describes how “every nation’s choices are limited by mountains, rivers, seas and concrete. Since then, the geography hasn’t changed. But the world has.” He has since published a sequel called “The Power of Geography” that explores ten regions that are set to shape global politics in a new age of great-power rivalry. These books outline the influence that geography has on geopolitics and global economics, pointing to that single factor (geography) as one of the most important, if not the most important, defining attributes of a nation.
The world of retail is not that different — geography dictates so much. To put it in David Bell’s words and work: “Location is (Still) Everything.” In his book he outlines how real world factors like state-specific sales tax rates, physical proximity to a store, and local cultures influence how people access and behave in the digital world. Put simply, “the way we use the internet is still largely shaped by the physical world we inhabit.”
The point is the real world still matters in e-commerce. This is an important foundational statement to start this post for a few reasons: (1) the traditional lens underpinning retail metrics is channel based (stores, web, etc), (2) most consumers are no longer single channel shoppers, and (3) all shoppers live in the real world.
So how does geography fit into this?
For years retail leaders and strategists have discussed the meaning of, and shared their thoughts on how to be, “omnichannel.” They mention how operating channels in silos will lead to internal channel competition and result in a disjointed customer experience, and further argue that channel metrics no longer represent the real value of those channels to customers (Nordstrom even stopped reporting same store sales at one point). However, not only do most consumer businesses still use channel specific metrics and operational silos (even the best in class “omnichannel” ones), but no one has really established a canonical view as to which metric(s) should be used to get past the channel attribution debate and challenge. Whether you believe channel metrics are still relevant or not, operators still need something, and I’ve yet to see a widely accepted view as to what that something is.
So here I propose the new lens (in painful detail) that should be the new standard — and I’ll back up how and why it works for retail (most of that in Part II).
Instead of (or at least in addition to) measuring channels, retailers should be reporting on Core Based Statistical Areas (CBSAs).
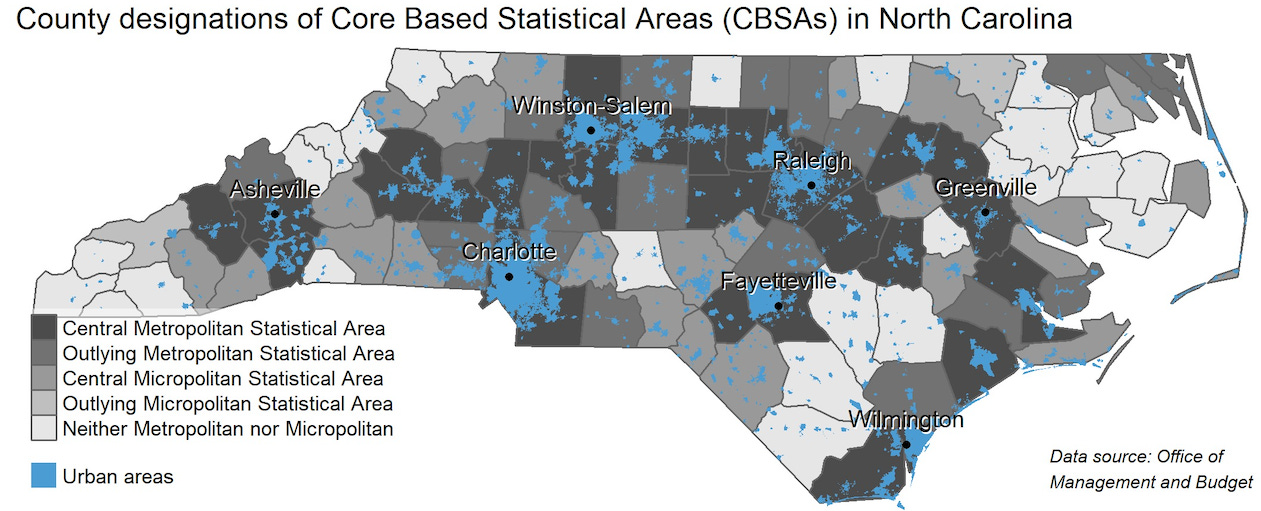
A CBSA is defined as a functional region based around an urban center of at least 10,000 people, based on standards published by the Office of Management and Budget (OMB). Furthermore, the term “CBSA” refers to both Metropolitan Statistical Areas (MSAs) and newly-created Micropolitan Areas collectively. Micro areas are based around Census Bureau-defined urban clusters of at least 10,000 and fewer than 50,000 people. Here’s a good historical overview of how these came to be.
To be clear, this isn’t an entirely new thought. Steve Dennis proposed the idea of shifting from same store sales to “same trade area” sales in 2017, and I started going nuts with it when I first joined Bonobos in 2015 (they were already using it when I joined, but to a limited degree). Given the channel fluidity consumers shop with back then and still today, it’s a better representation of the store’s impact even on the web (commonly referred to as the “halo effect”).
Furthermore, many DTC brands and studies have focused on measuring geographies before. However, they’ve typically quoted zip code growth, and/or measure with cities or states as the geographic lens. Before explaining why CBSAs/MSAs are the better approach, I want to first point out the flaws of the other common approaches, starting with the smallest geographic lens.
- Zip Code: There’s a really interesting deep dive on the Untold Story of the Zip Code, but to sum it up, zip codes were (and still are) a tool of the US Postal Service to streamline, organize, and distribute the mail. While there are certainly some similarities between the demographics of a zip code’s residents, zip codes were not really built with that purpose in mind (organizing people by demographics/psychographics/etc). And more importantly for retail operators, (1) there are over 41,000 zip codes, making this lens unmanageable (imagine store reporting with 41,000 locations), and (2) not intuitive (do you know where 02648 is off the top of your head?).
- City: While cities are intuitive on the surface, their collective boundaries are determined by a hodgepodge of factors. And in many cases, those city boundaries don’t mark significantly different attributes between each city’s residents (many NJ and CT residents shop, work, and often visit NY). A “city” is also oddly not commonly understood: do you know the difference between Santa Monica and Los Angeles? Cities often get confused with Counties, and vice versa, which leads to inconsistent usage in data and, perhaps more importantly, its interpretation.
- State: States are the most digestible (only 50 of course), but have a similar issue as cities in that the boundaries are were not necessarily created to carve out like-minded people (although residents over time certainly self select into that sometimes). If nothing else, state boundaries don’t change, while populations and their behaviors do.
- DMA: Designated Market Areas are also referred to as media markets, and are regions of the United States that are used to define television and radio markets. There’s ~200 which is digestible, and the names actually are intuitive (eg “New York”)! However, as noted in this article from 2014, DMAs are (1) owned/managed by Nielsen Company, and (2) intended for marketers based on “how people consume media, not their commuting patterns or where they buy their groceries.” DMAs have their place, but they still don’t reflect consumers and “where they buy their groceries” — the latter point is precisely what we do want.
So why do I like CBSAs? A lot of reasons:
- The boundary of an CBSA is determined by the geofence “containing a substantial population nucleus, together with adjacent communities having a high degree of economic and social integration with that core.” Put simply, the boundaries are drawn with human behavior and communities in mind. Much in the same way a market’s residents broadly support the same sports teams, you’d be surprised to learn how similarly those residents consume goods.
- The names are intuitive (but admittedly can have lengthy character counts like: New York-Newark-Jersey City NY-NJ-PA)
- There are ~900 CBSAs which is a lot but it’s digestible; many businesses likely do ~80% of their business in their top ~50 MSAs, so an effective approach is to focus on your top 50 MSAs and bucket the remaining long tail; and many larger retailers have hundreds if not thousands of locations and have learned how to manage them (note that only 7-Eleven and Subway have more locations than there are zip codes) — in other words, there’s a lot, but most of your business is likely concentrated in a very digestible short list.
- There’s a TON of rich data available at the CBSA level that is accessible
- If you have stores, CBSAs provide an added bonus: they can be a proxy for a trade area. Most definitions of a trade area simply say “the geographic region from which a majority of your business is generated,” but I’ve always been a fan of the more precise “region from which at least 80% of your business is generated.” The really cool observation I’ve had is that many DTC brands with stores actually prove that out: over 50% of a store’s sales come from the “home” CBSA where it’s located (meeting the general “majority” qualification), and more interestingly on many occasions I’ve seen it actually somewhere between 80–90%. Whoa. It’s an easy shortcut vs identifying the top zip codes.
As many businesses these days operate multiple channels, it’s inevitable that your customer will interact with more than one of them before a purchase. Channel attribution lenses give 100% credit to the channel where the journey ended, and zero credit to anything else — in other words, the traditional channel lens is final touch attribution. I love the CBSA lens for omnichannel businesses (and even single channel businesses) because it ignores the misleading interpretations that come with final touch attribution. Would it seem sensible to you to give 100% of the sale to the web/store if the customer spent 90% of their time in another channel before their purchase? And before you think, “well that’s what multi-touch attribution models are for,” I ask you this: how do you know the attribution model is right for every market? As I mentioned before, people shop differently in different geographies — a one size fits all model does not work.
All that said, while I’m making a strong case for the universal use and standardization of CBSAs, I also want to acknowledge that this isn’t necessarily meant to replace standard channel reporting (if for no other than reason than the mere fact that channel reporting is the current common language). However, a geographic lens — CBSAs in particular — can be a powerful tool to unlock growth for your business, and identify challenges with your customer base, while avoiding the attribution debates.
Author: 1rec_admin
1REC Founder


